The Average Annual Return OF Nvidia Stock (NVDA) from 2000 to 2024 Is Approximately 66.41%. If You Had Invested $1000 in Nvidia Stock At The Beginning Of 2000 And Held It Through The End Of 2024, Your Investment Would Have Grown To Approximately $1,493,528.43. Whether you’re a long-term investor or a market enthusiast, understanding Nvidia’s year-by-year performance offers valuable insights into its financial journey and stock market behavior.
Historical Annual Returns Data Of Nvidia Stock
| Year | Year Open | Year Close | Annual Returns |
|---|---|---|---|
| 2000 | $0.08 | $0.12 | 39.58% |
| 2001 | $0.11 | $0.51 | 308.31% |
| 2002 | $0.51 | $0.08 | -82.79% |
| 2003 | $0.09 | $0.17 | 101.48% |
| 2004 | $0.17 | $0.18 | 1.52% |
| 2005 | $0.18 | $0.27 | 55.22% |
| 2006 | $0.29 | $0.56 | 102.43% |
| 2007 | $0.55 | $0.77 | 37.89% |
| 2008 | $0.75 | $0.18 | -76.28% |
| 2009 | $0.19 | $0.42 | 131.46% |
| 2010 | $0.42 | $0.35 | -17.56% |
| 2011 | $0.36 | $0.31 | -10.00% |
| 2012 | $0.32 | $0.28 | -10.95% |
| 2013 | $0.29 | $0.37 | 33.51% |
| 2014 | $0.37 | $0.48 | 27.40% |
| 2015 | $0.48 | $0.80 | 67.12% |
| 2016 | $0.78 | $2.62 | 226.96% |
| 2017 | $2.51 | $4.78 | 81.98% |
| 2018 | $4.92 | $3.31 | -30.81% |
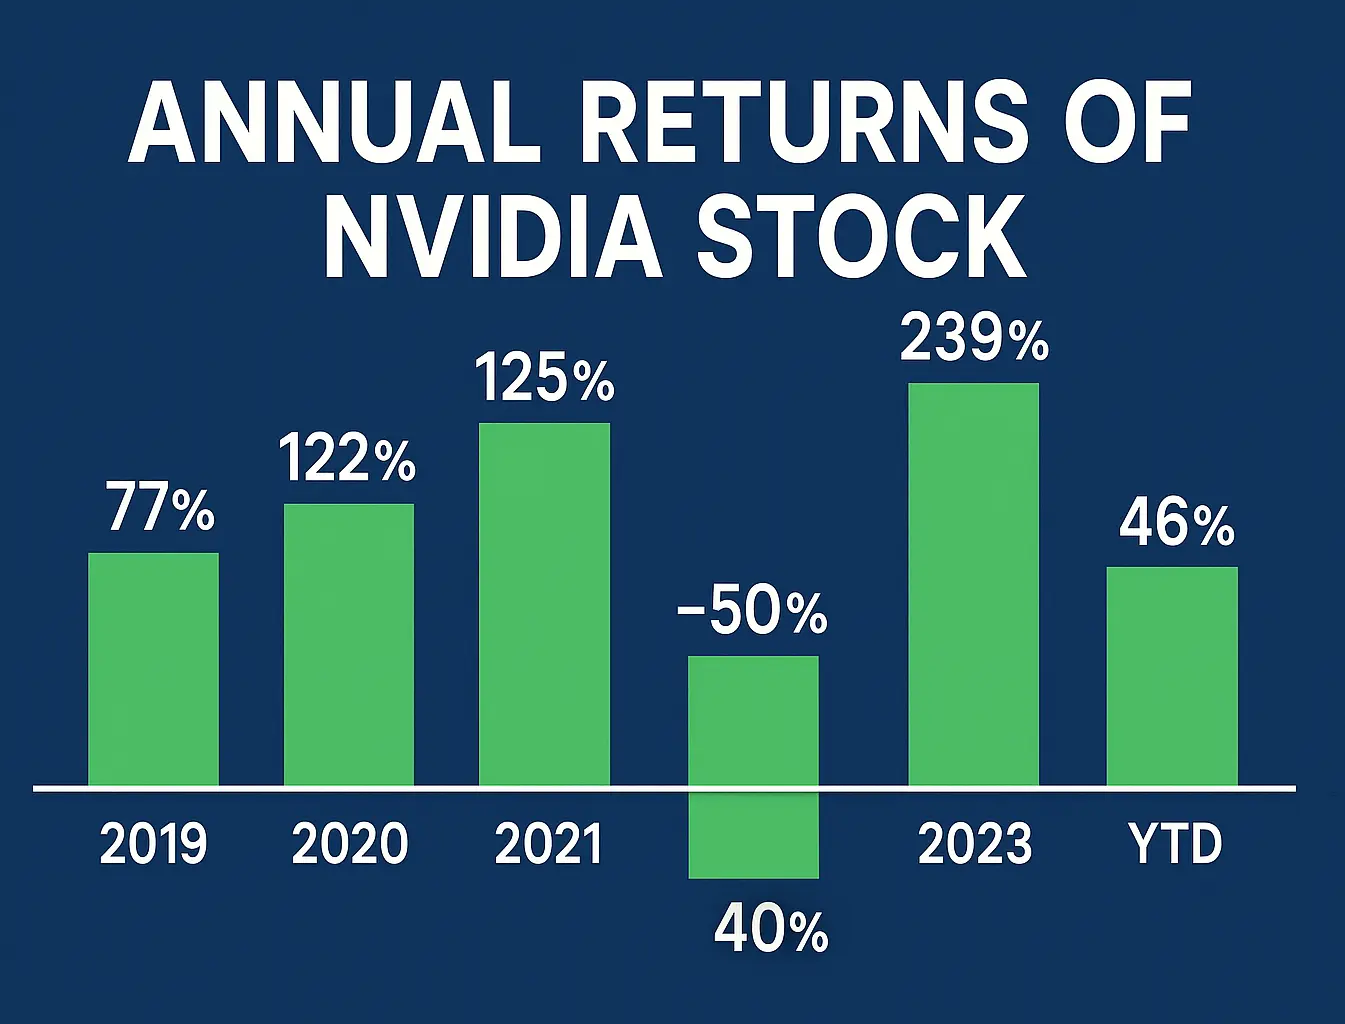
| 2019 | $3.37 | $5.85 | 76.94% |
| 2020 | $5.97 | $13.02 | 122.30% |
| 2021 | $13.08 | $29.36 | 125.48% |
| 2022 | $30.07 | $14.60 | -50.26% |
| 2023 | $14.30 | $49.50 | 239.02% |
| 2024 | $48.15 | $134.27 | 171.23% |
If You Want To Learn More About Nvidia Stock, Visit Yahoo Finance. To Explore Other Companies’ Performance, Check Out Our US Stock Category.
[recent_post_carousel limit=»-1″ show_content=»false» show_date=»false» dots=»false» autoplay_interval=»5000″ show_author=»false» media_size=»full» category=»18″]
Deja una respuesta