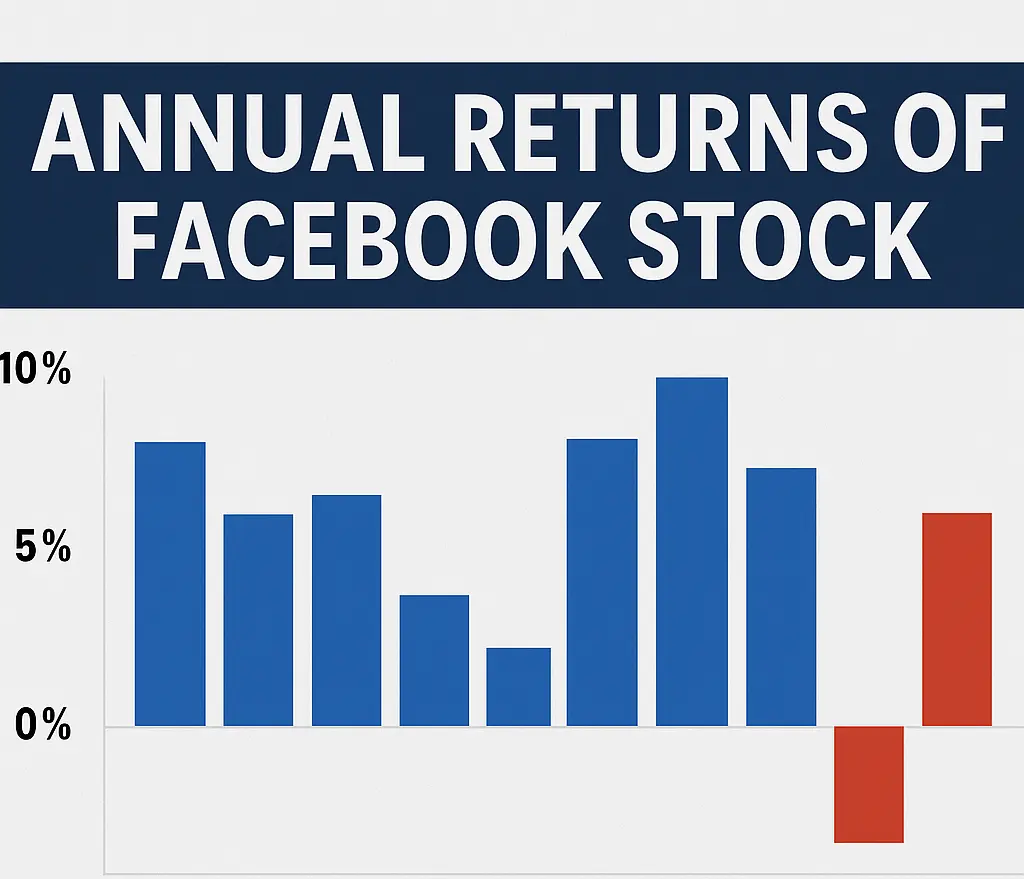
The Average Annual Return OF Facebook Stock (META) from 2013 to 2024 Is Approximately 36.22%. If You Had Invested $1000 in Facebook Stock At The Beginning Of 2013 And Held It Through The End Of 2024, Your Investment Would Have Grown To Approximately $22360.32. Whether you’re a long-term investor or a market enthusiast, understanding Facebook’s year-by-year performance offers valuable insights into its financial journey and stock market behavior.
Historical Annual Returns Data Of Facebook Stock
| Year | Year Open | Year Close | Annual Returns |
|---|---|---|---|
| 2013 | $27.86 | $54.39 | 105.30% |
| 2014 | $54.45 | $77.65 | 42.77% |
| 2015 | $78.08 | $104.16 | 34.15% |
| 2016 | $101.74 | $114.51 | 9.93% |
| 2017 | $116.31 | $175.63 | 53.38% |
| 2018 | $180.56 | $130.47 | -25.71% |
| 2019 | $135.04 | $204.28 | 56.57% |
| 2020 | $208.79 | $271.87 | 33.09% |
| 2021 | $267.67 | $334.77 | 23.13% |
| 2022 | $336.95 | $119.77 | -64.22% |
| 2023 | $124.15 | $352.30 | 194.13% |
| 2024 | $344.66 | $584.99 | 66.05% |
If You Want To Learn More About Facebook Stock, Visit Yahoo Finance. To Explore Other Companies’ Performance, Check Out Our US Stock Category.
[recent_post_carousel limit=»-1″ show_content=»false» show_date=»false» dots=»false» autoplay_interval=»5000″ show_author=»false» media_size=»full» category=»18″]
Deja una respuesta