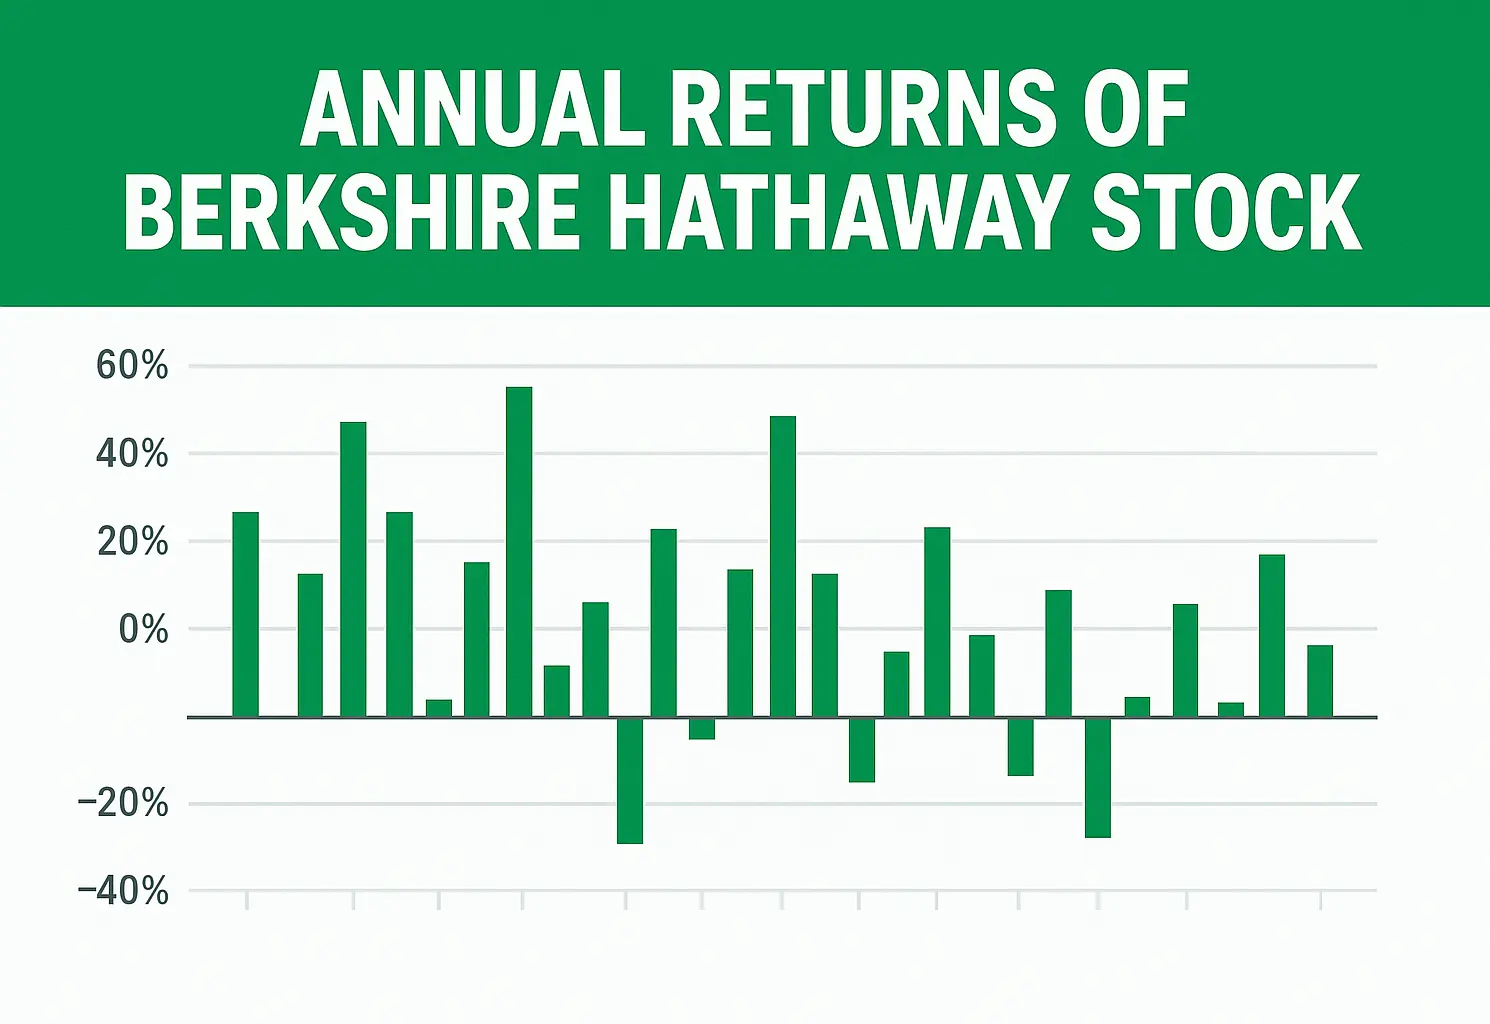
The Average Annual Return OF Berkshire Hathaway Stock (BRK.B) from 1997 to 2024 Is Approximately 13.13%. If You Had Invested $1000 in Berkshire Hathaway Stock At The Beginning Of 1997 And Held It Through The End Of 2024, Your Investment Would Have Grown To Approximately $19,501.88. Whether you’re a long-term investor or a market enthusiast, understanding Berkshire Hathaway’s year-by-year performance offers valuable insights into its financial journey and stock market behavior.
Historical Annual Returns Data Of Berkshire Hathaway Stock
| Year | Year Open | Year Close | Annual Returns |
|---|---|---|---|
| 1997 | $21.94 | $30.78 | 38.40% |
| 1998 | $30.58 | $47.00 | 52.70% |
| 1999 | $46.60 | $36.60 | -22.13% |
| 2000 | $35.30 | $47.08 | 28.63% |
| 2001 | $48.22 | $50.50 | 7.26% |
| 2002 | $49.68 | $48.46 | -4.04% |
| 2003 | $47.88 | $56.30 | 16.18% |
| 2004 | $56.06 | $58.72 | 4.30% |
| 2005 | $57.98 | $58.71 | 0.02% |
| 2006 | $59.30 | $73.32 | 24.89% |
| 2007 | $72.86 | $94.72 | 29.19% |
| 2008 | $92.10 | $64.28 | -32.14% |
| 2009 | $66.46 | $65.72 | -2.24% |
| 2010 | $66.22 | $80.11 | 21.90% |
| 2011 | $80.41 | $76.30 | -4.76% |
| 2012 | $77.68 | $89.70 | 17.56% |
| 2013 | $93.20 | $118.56 | 32.17% |
| 2014 | $117.50 | $150.15 | 26.64% |
| 2015 | $149.17 | $132.04 | -12.06% |
| 2016 | $130.75 | $162.98 | 23.43% |
| 2017 | $163.83 | $198.22 | 21.62% |
| 2018 | $197.22 | $204.18 | 3.01% |
| 2019 | $202.80 | $226.50 | 10.93% |
| 2020 | $228.39 | $231.87 | 2.37% |
| 2021 | $228.45 | $299.00 | 28.95% |
| 2022 | $300.79 | $308.90 | 3.31% |
| 2023 | $309.91 | $356.66 | 15.46% |
| 2024 | $362.46 | $453.28 | 27.09% |
If You Want To Learn More About Berkshire Hathaway Stock, Visit Yahoo Finance. To Explore Other Companies’ Performance, Check Out Our US Stock Category.
[recent_post_carousel limit=»-1″ show_content=»false» show_date=»false» dots=»false» autoplay_interval=»5000″ show_author=»false» media_size=»full» category=»18″]
Deja una respuesta